energy_bandgap#
- optika.sensors.energy_bandgap(temperature=<Quantity 300. K>)[source]#
Bandgap energy in silicon given by Ramanathan and Kurinsky [2020].
- Parameters:
temperature (Quantity | ScalarArray) – The temperature of the silicon.
- Return type:
Examples
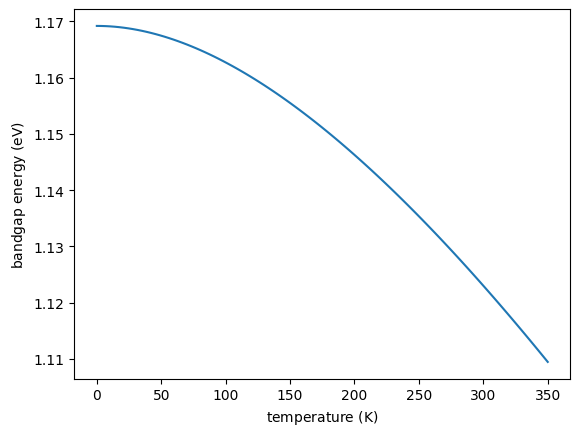
Reproduce Figure 2 of Ramanathan and Kurinsky [2020], and plot the bandgap energy as a function of temperature.
import matplotlib.pyplot as plt
import astropy.units as u
import astropy.visualization
import named_arrays as na
import optika

T = na.linspace(0, 350, axis="temperature", num=101) * u.K
energy_gap = optika.sensors.energy_bandgap(T)

with astropy.visualization.quantity_support():
    fig, ax = plt.subplots()
    na.plt.plot(
        T,
        energy_gap
    )
    ax.set_xlabel(f"temperature ({ax.get_xlabel()})")
    ax.set_ylabel(f"bandgap energy ({ax.get_ylabel()})")
Notes
Ramanathan and Kurinsky [2020] gives the bandgap energy as
\[E_g(T) = E_g(0) - \frac{a T^2}{T + b}\]where \(T\) is the temperature of the silicon, \(E_g(0) = 1.192 \, \text{eV}\), \(a = 4.9 \times 10^{-4} \, \text{eV / K}\), and \(b = 655 \, \text{K}\).
References to
optika.sensors.energy_bandgap