PolynomialVignettingModel#
- class optika.radiometry.PolynomialVignettingModel(coordinates_scene, illumination, axis_wavelength, axis_field, degree=1, where=True)[source]#
Bases:
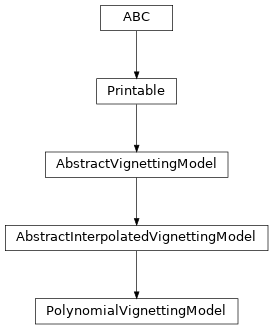
AbstractInterpolatedVignettingModelA vignetting model which fits a polynomial to the measured illumination at known scene coordinates.
Examples
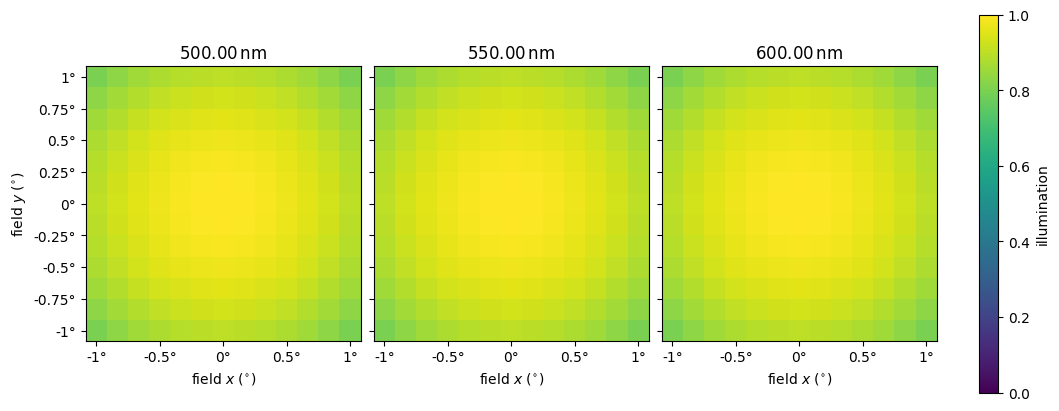
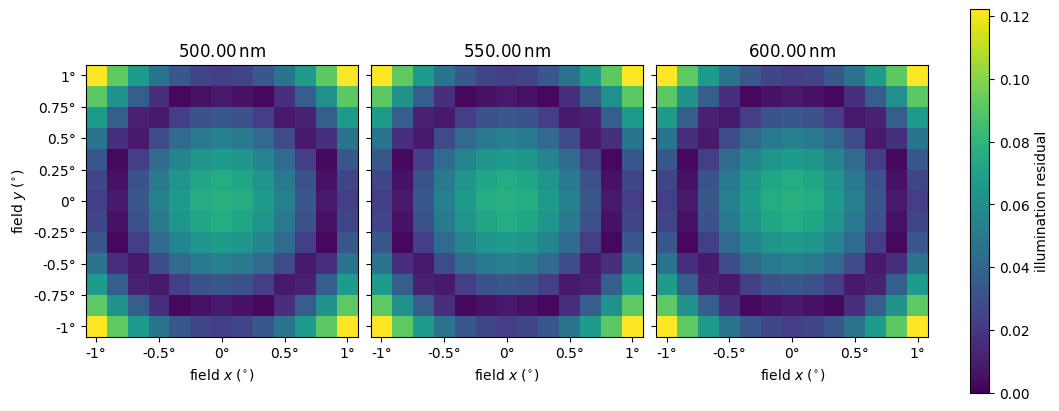
Build a vignetting model with a radial illumination falloff fit by a deliberately underfit (linear) polynomial, then plot the illumination and the fit residual.
import numpy as np
import astropy.units as u
import named_arrays as na
import optika

scene = na.SpectralPositionalVectorArray(
    wavelength=na.linspace(500, 600, axis="wavelength", num=3) * u.nm,
    position=na.Cartesian2dVectorLinearSpace(
        start=-1 * u.deg,
        stop=+1 * u.deg,
        axis=na.Cartesian2dVectorArray("field_x", "field_y"),
        num=13,
    ),
)
illumination = 1 - 0.1 * (scene.position.length / u.deg) ** 2

model = optika.radiometry.PolynomialVignettingModel(
    coordinates_scene=scene,
    illumination=illumination,
    axis_wavelength="wavelength",
    axis_field=("field_x", "field_y"),
    degree=1,
)

fig, ax = model.plot()
na.plt.set_aspect("equal", ax=ax);

fig, ax = model.plot_residual()
na.plt.set_aspect("equal", ax=ax);
Attributes
The logical axes corresponding to changing position in the scene.
The logical axis corresponding to changing wavelength.
The wavelength and position of each calibration point in the scene.
The degree of the polynomial used to model the vignetting.
The polynomial fit mapping scene coordinates to illumination.
The relative illumination at each calibration point.
A boolean mask selecting which calibration points to use for fitting.
Methods
__init__(coordinates_scene, illumination, ...)inverse(coordinates)Compute the inverse of the illumination, \(1 / I\), the factor which corrects for the vignetting at the given scene coordinates.
plot([figsize, cmap, vmin, vmax])Plot the calibration
illuminationas a function of field angle, with a separate subplot for each wavelength.plot_residual([figsize, cmap, vmin, vmax])Plot the residual of the
fitas a function of field angle, with a separate subplot for each wavelength.to_string([prefix])Public-facing version of the
__repr__method that allows for defining a prefix string, which can be used to calculate how much whitespace to add to the beginning of each line of the result.Inheritance Diagram
- Parameters:
coordinates_scene (AbstractSpectralPositionalVectorArray)
illumination (AbstractScalar)
axis_wavelength (str)
degree (int)
where (bool | AbstractScalar)
- inverse(coordinates)#
Compute the inverse of the illumination, \(1 / I\), the factor which corrects for the vignetting at the given scene coordinates.
- Parameters:
coordinates (AbstractSpectralPositionalVectorArray) – The wavelength and position of each point in the scene.
- Return type:
- plot(figsize=None, cmap=None, vmin=None, vmax=None, **kwargs)[source]#
Plot the calibration
illuminationas a function of field angle, with a separate subplot for each wavelength.- Parameters:
figsize (None | tuple[float, float]) – The size of the returned figure in inches. If
None, the size is chosen automatically from the number of wavelengths and the aspect ratio of the field of view.cmap (None | str | Colormap) – The colormap used to map the illumination to colors.
vmin (None | int | float | complex | ndarray | Quantity | AbstractArray) – The illumination value mapped to the lowest color. If
None, defaults to zero.vmax (None | int | float | complex | ndarray | Quantity | AbstractArray) – The illumination value mapped to the highest color. If
None, defaults to the maximum illumination.kwargs – Additional keyword arguments passed to
named_arrays.plt.pcolormesh().
- Return type:
- plot_residual(figsize=None, cmap=None, vmin=None, vmax=None, **kwargs)[source]#
Plot the residual of the
fitas a function of field angle, with a separate subplot for each wavelength.The residual is the absolute difference between the calibration
illuminationand the illumination predicted by the polynomial fit.- Parameters:
figsize (None | tuple[float, float]) – The size of the returned figure in inches. If
None, the size is chosen automatically from the number of wavelengths and the aspect ratio of the field of view.cmap (None | str | Colormap) – The colormap used to map the residual to colors.
vmin (None | int | float | complex | ndarray | Quantity | AbstractArray) – The residual value mapped to the lowest color. If
None, defaults to zero.vmax (None | int | float | complex | ndarray | Quantity | AbstractArray) – The residual value mapped to the highest color. If
None, defaults to the maximum residual.kwargs – Additional keyword arguments passed to
named_arrays.plt.pcolormesh().
- Return type:
- to_string(prefix=None)#
Public-facing version of the
__repr__method that allows for defining a prefix string, which can be used to calculate how much whitespace to add to the beginning of each line of the result.
- axis_field: tuple[str, str] = <dataclasses._MISSING_TYPE object>#
The logical axes corresponding to changing position in the scene.
- axis_wavelength: str = <dataclasses._MISSING_TYPE object>#
The logical axis corresponding to changing wavelength.
- coordinates_scene: AbstractSpectralPositionalVectorArray = <dataclasses._MISSING_TYPE object>#
The wavelength and position of each calibration point in the scene.
- property fit: PolynomialFitFunctionArray#
The polynomial fit mapping scene coordinates to illumination.
- illumination: AbstractScalar = <dataclasses._MISSING_TYPE object>#
The relative illumination at each calibration point.
- where: bool | AbstractScalar = True#
A boolean mask selecting which calibration points to use for fitting.